

Here is a short tutorial on how to visualize your bi data using open bi and Bing Maps in Microsoft Excel.
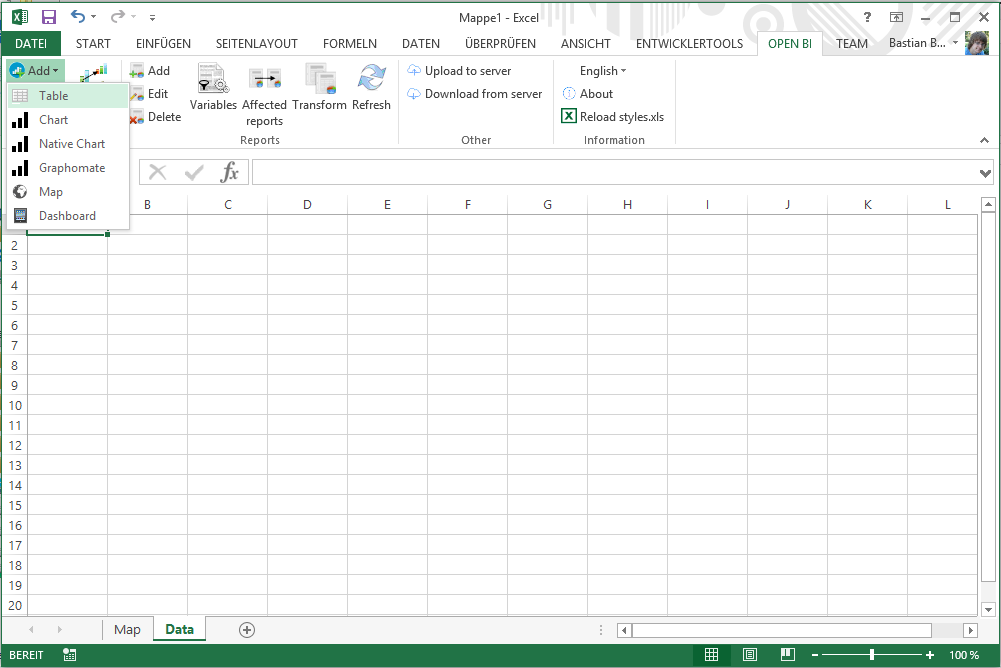
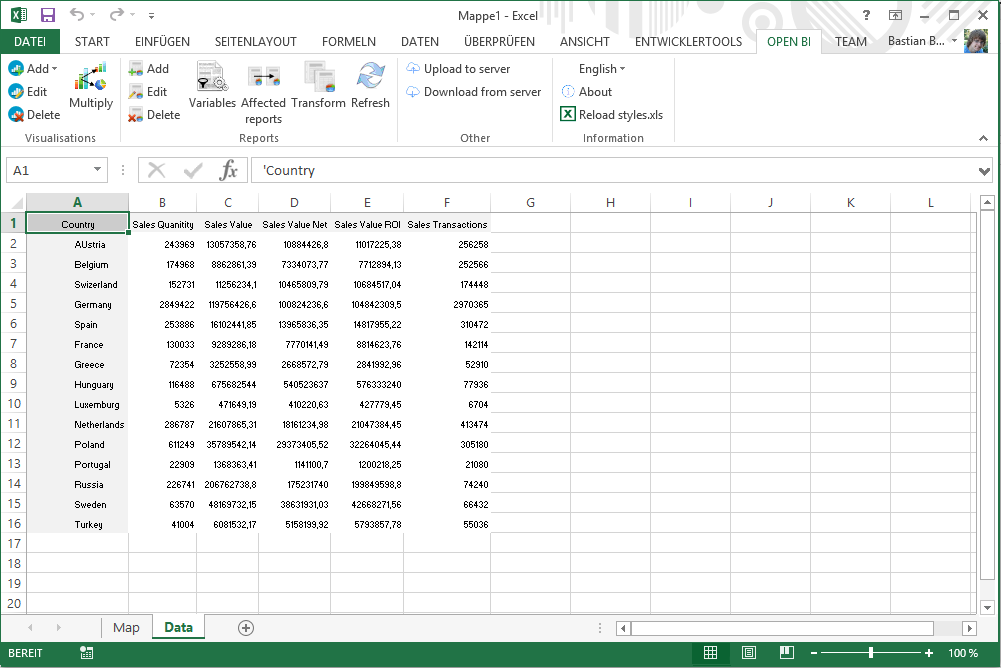
First insert a table with your bi data into an excel sheet. (Make sure that the data does not contain sum rows.)
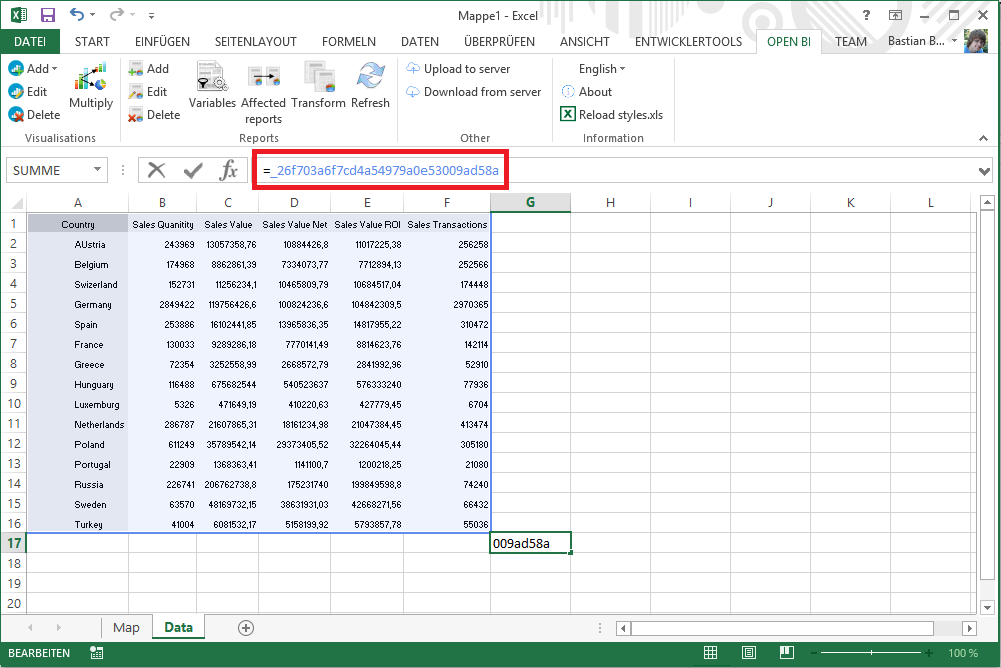
After that copy the name of the excel range which contains the table data. The name always begins with an underscore.
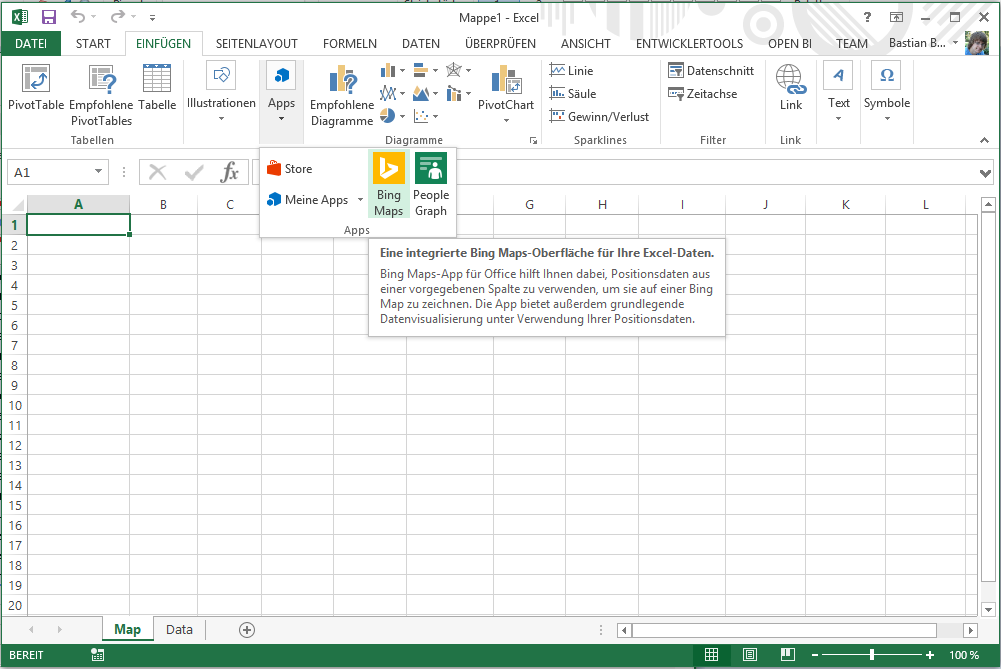
Insert a Bing Map into another excel sheet by using the Bing Maps app.
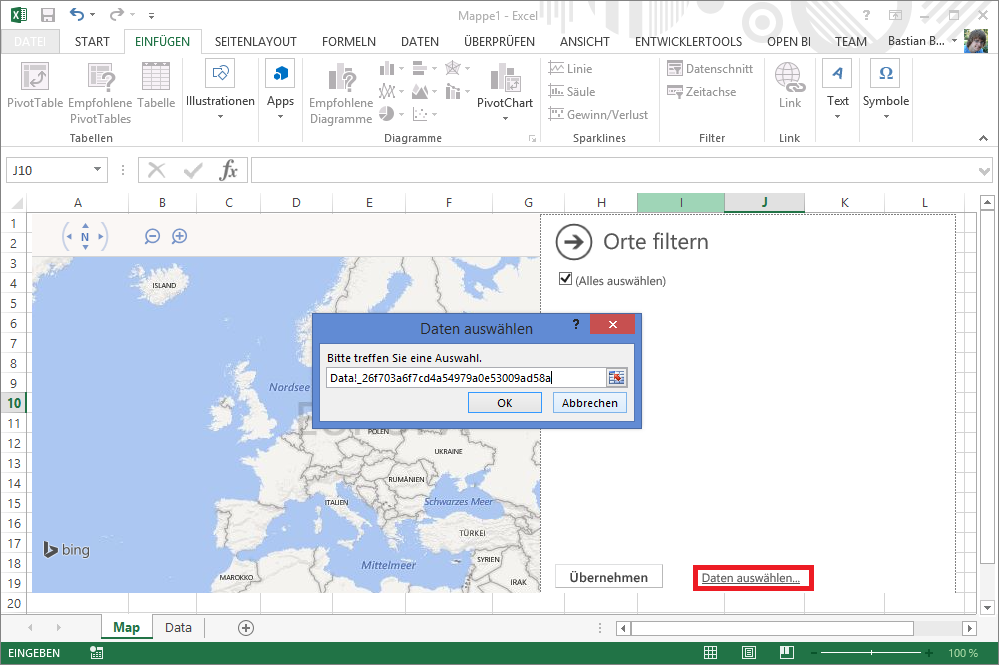
Then select the data range by using the named excel range.
And that is it! Now you have a map with your bi data.
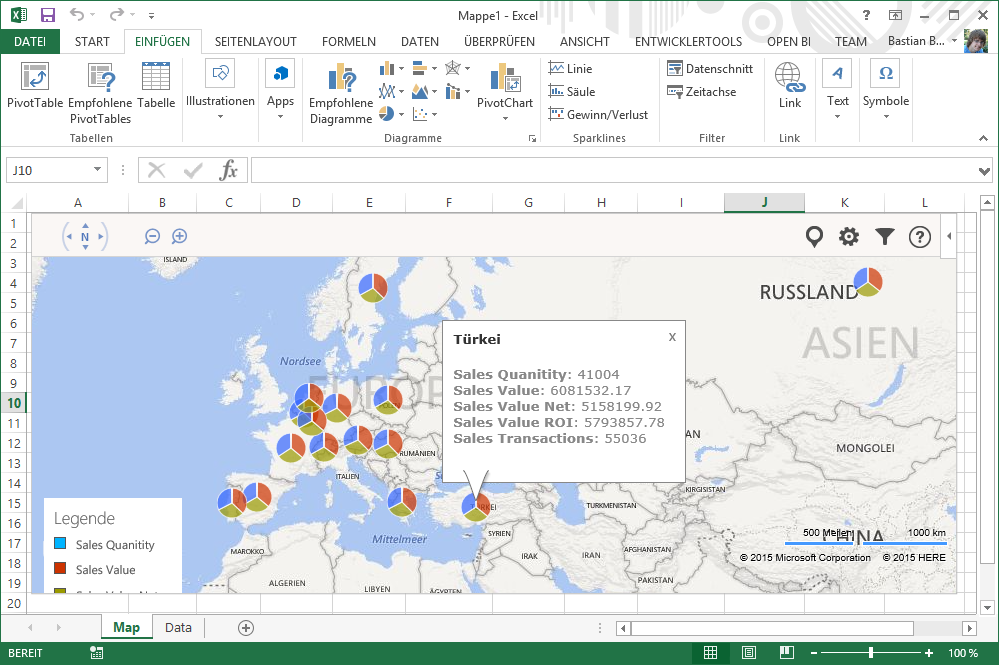
You can now filter your data and the Bing Map will update automatically.