

These days it is often proclaimed that data analysis should always be both cloud- and web-based.
We see this a little more differentiated:
Of course it is good to be able to access data adhoc from whereever you are with a standard web client. But at the same time, business users want to use data not only for analysis. They rather want to use and visualize data in other scenarios as well.
Two of these scenarios is giving a presentation to an audience and compiling a document with important business information. For years there have already been tools in place that support the business users in these scenarios: Microsoft PowerPoint and Microsoft Word.
Although we also offer a web-based analysis and dashboarding solution with biAnalytics Web, we still see a srtong need for integration into the Microsoft Office suite.
Integrating new features via an addin has several plain advantages, compared to a newly designed stand-alone tool (as SAP tried with Lumira Discovery):
- biAnalytics is tightly integrated with PowerPoint and Word. It is simply an addon that you have to install.
- We did not have to rebuild, but we can reuse what’s already there
- We were able to put all our resources in building the visualization and data preparation parts to make this really easy to use and powerful.
- For all other parts, we were able to reuse features that are already really easy to use (and Microsoft knows how long a road it was to make a visualization tool easy to use – just think of the Office versions back in the 90s and early 2000s!)
Let's see how biAnalytics Office works in detail:
- We start with a PowerPoint presentation I created with a clear corporate design.
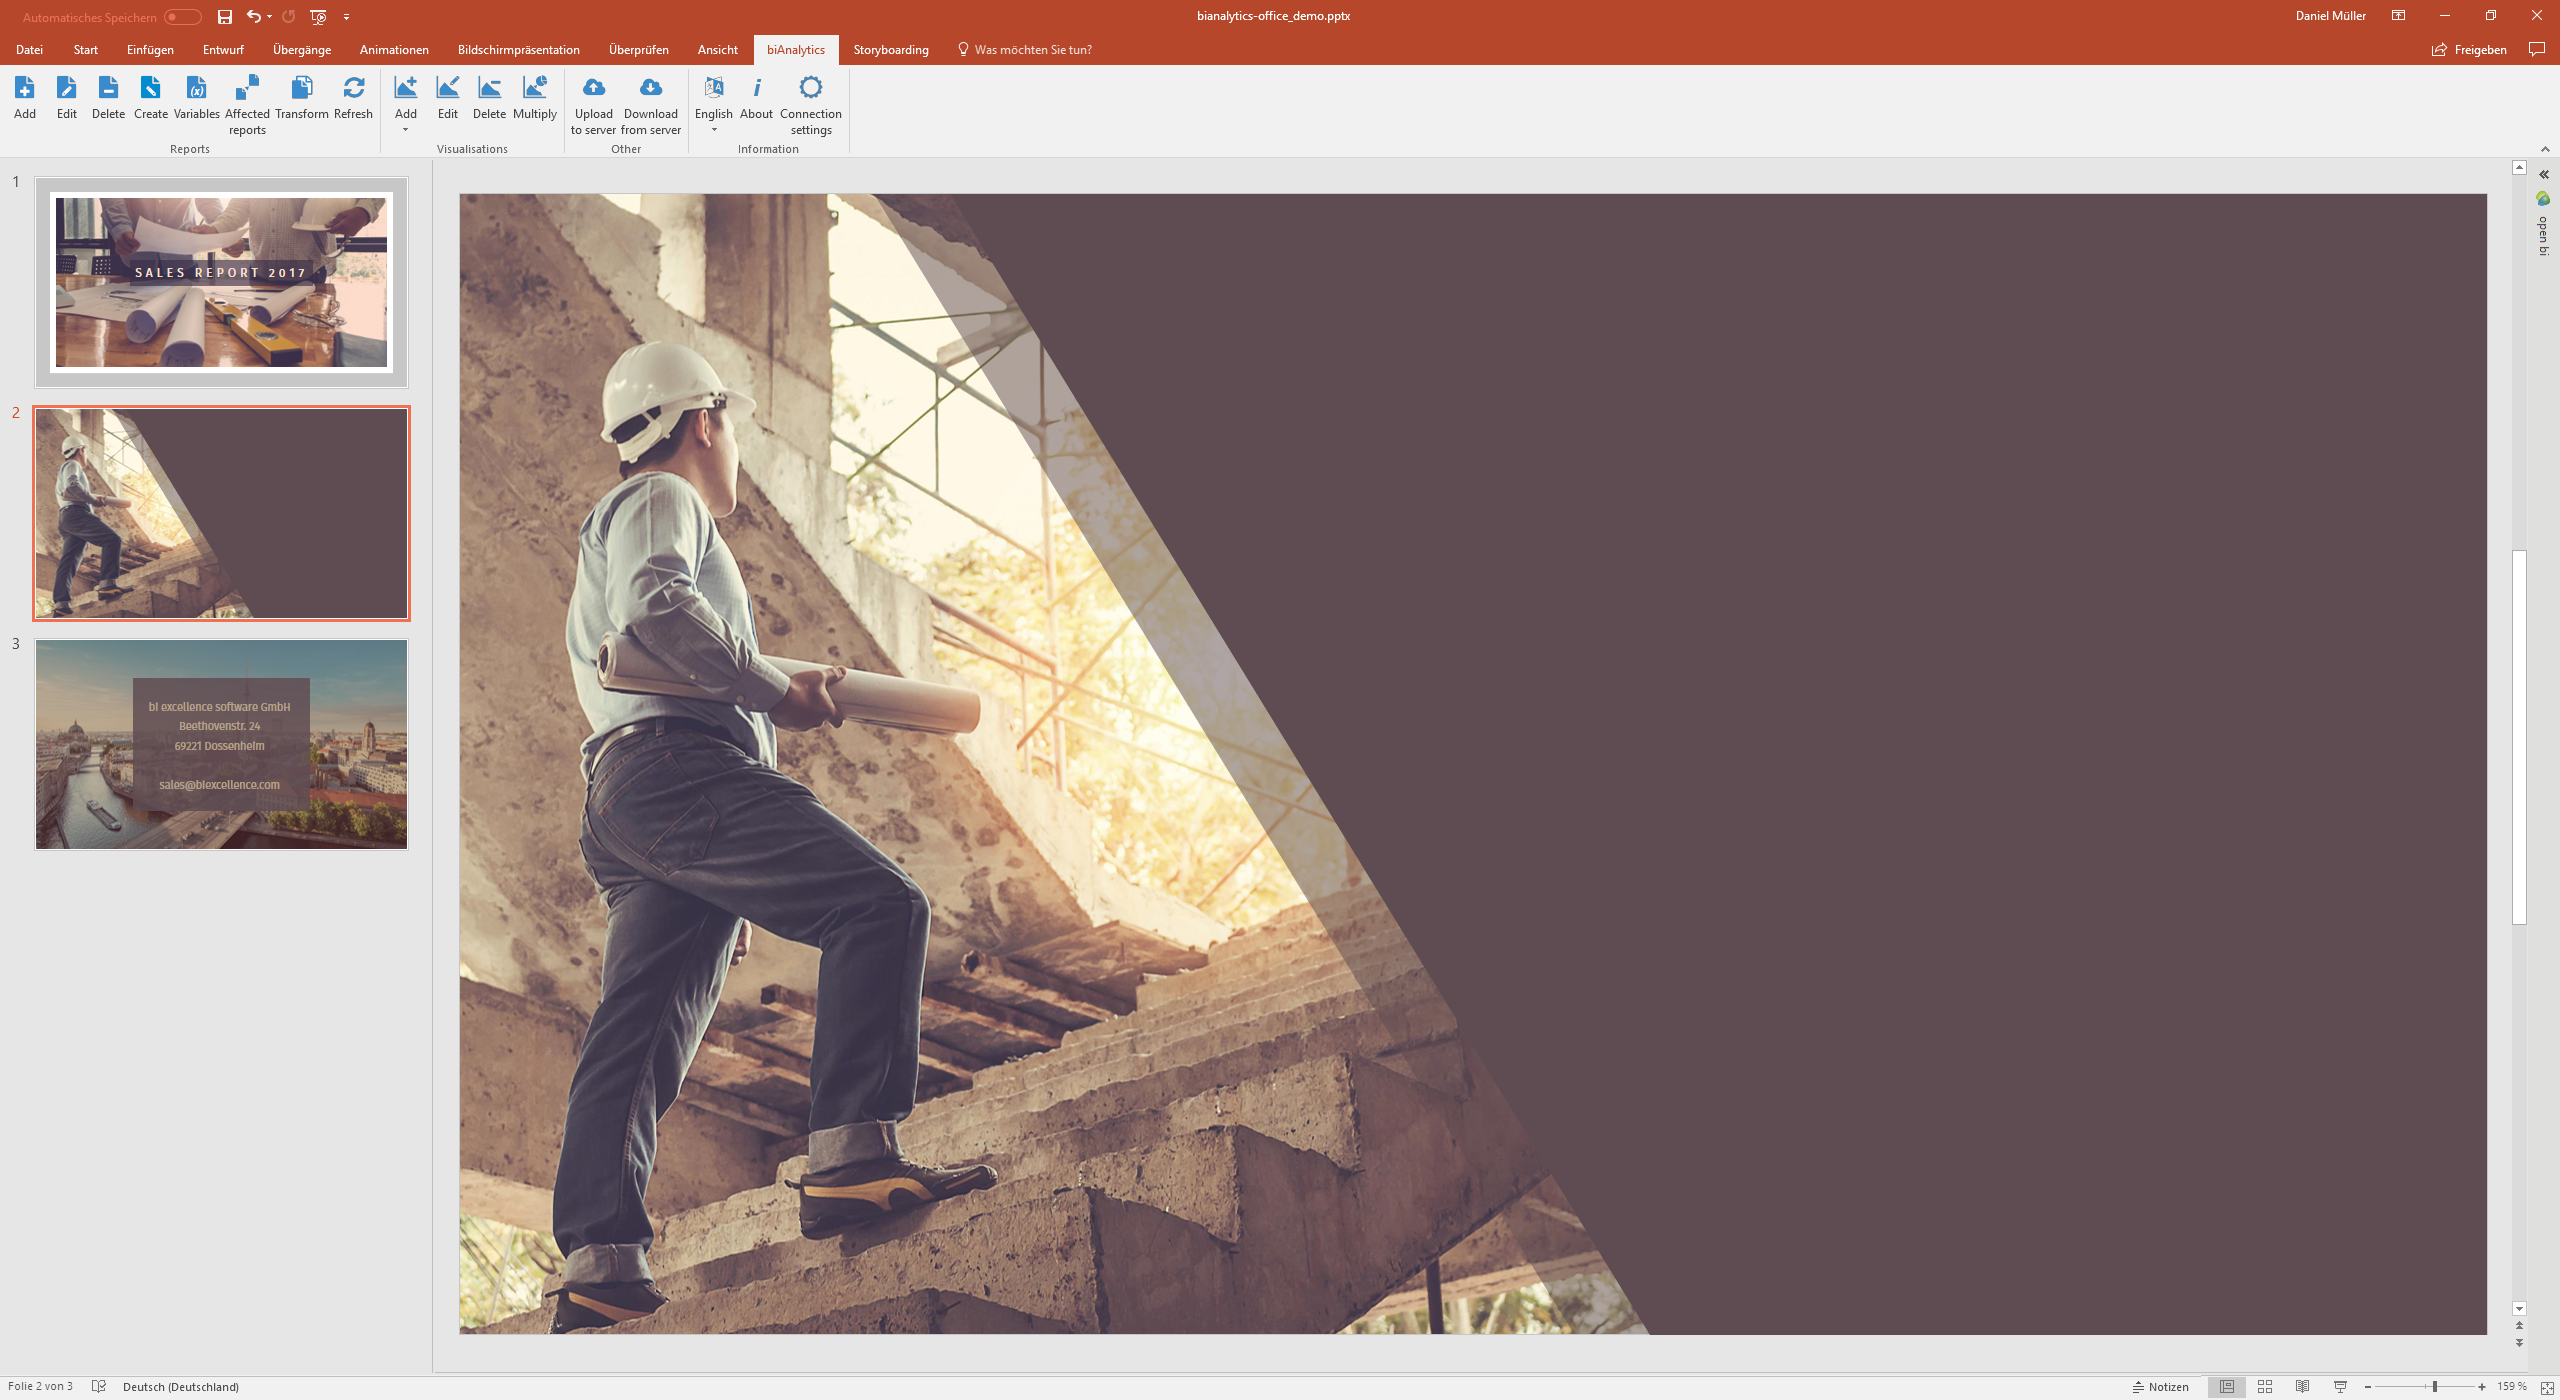
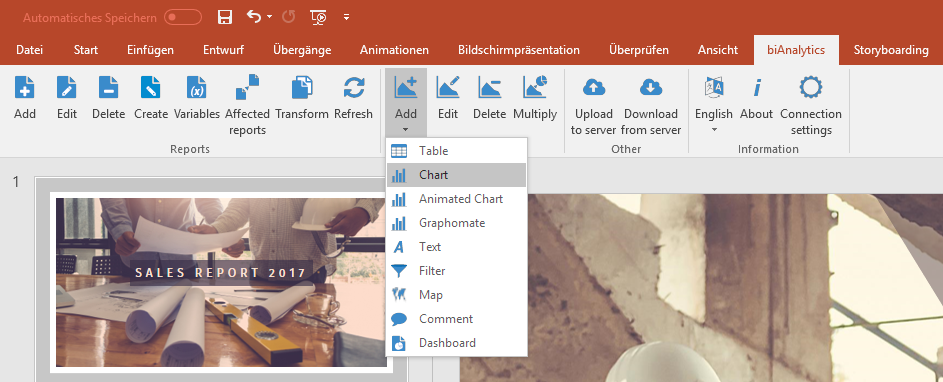
- Having biAnalytics Office installed I can now navigate to the "biAnalytics" tab to directly add a new visualization and data source.
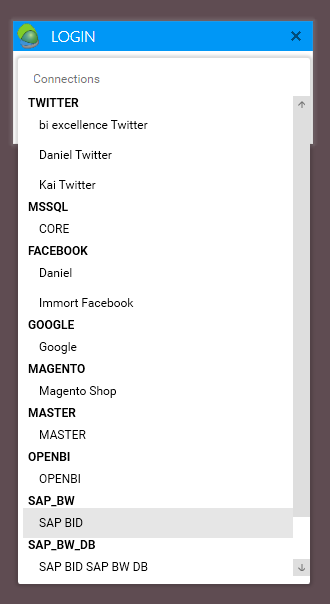
- My account has access to several data sources. Using the open bi framework biAnalytics is able to connect live to any kind of data source, e.g. databases, Twitter, Facebook and Google. In our example, we connect directly to SAP BW.
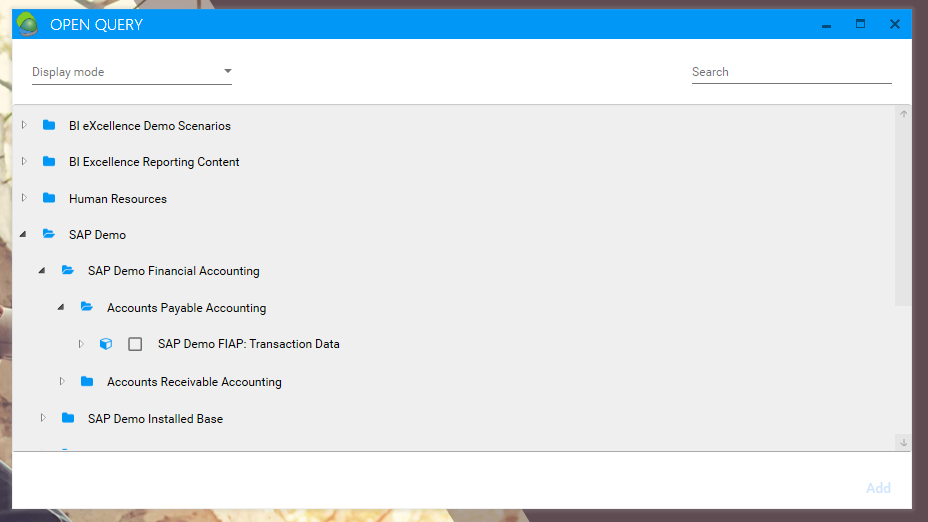
- Having chosen the SAP BW connection, I can see all InfoPorivders and Queries that my user is authorized for. I search for a report and click on "Add".
- biAnalytics has now created a new PowerPoint Chart based on the live data loaded from the SAP system. It is important to know that no data is being replicated – rather, data are always requested directly from the system whenever a view is changed.
Since I have defined colors and font styles for the charts in my PowerPoint presentation the new chart fits beautifully into my PowerPoint Design.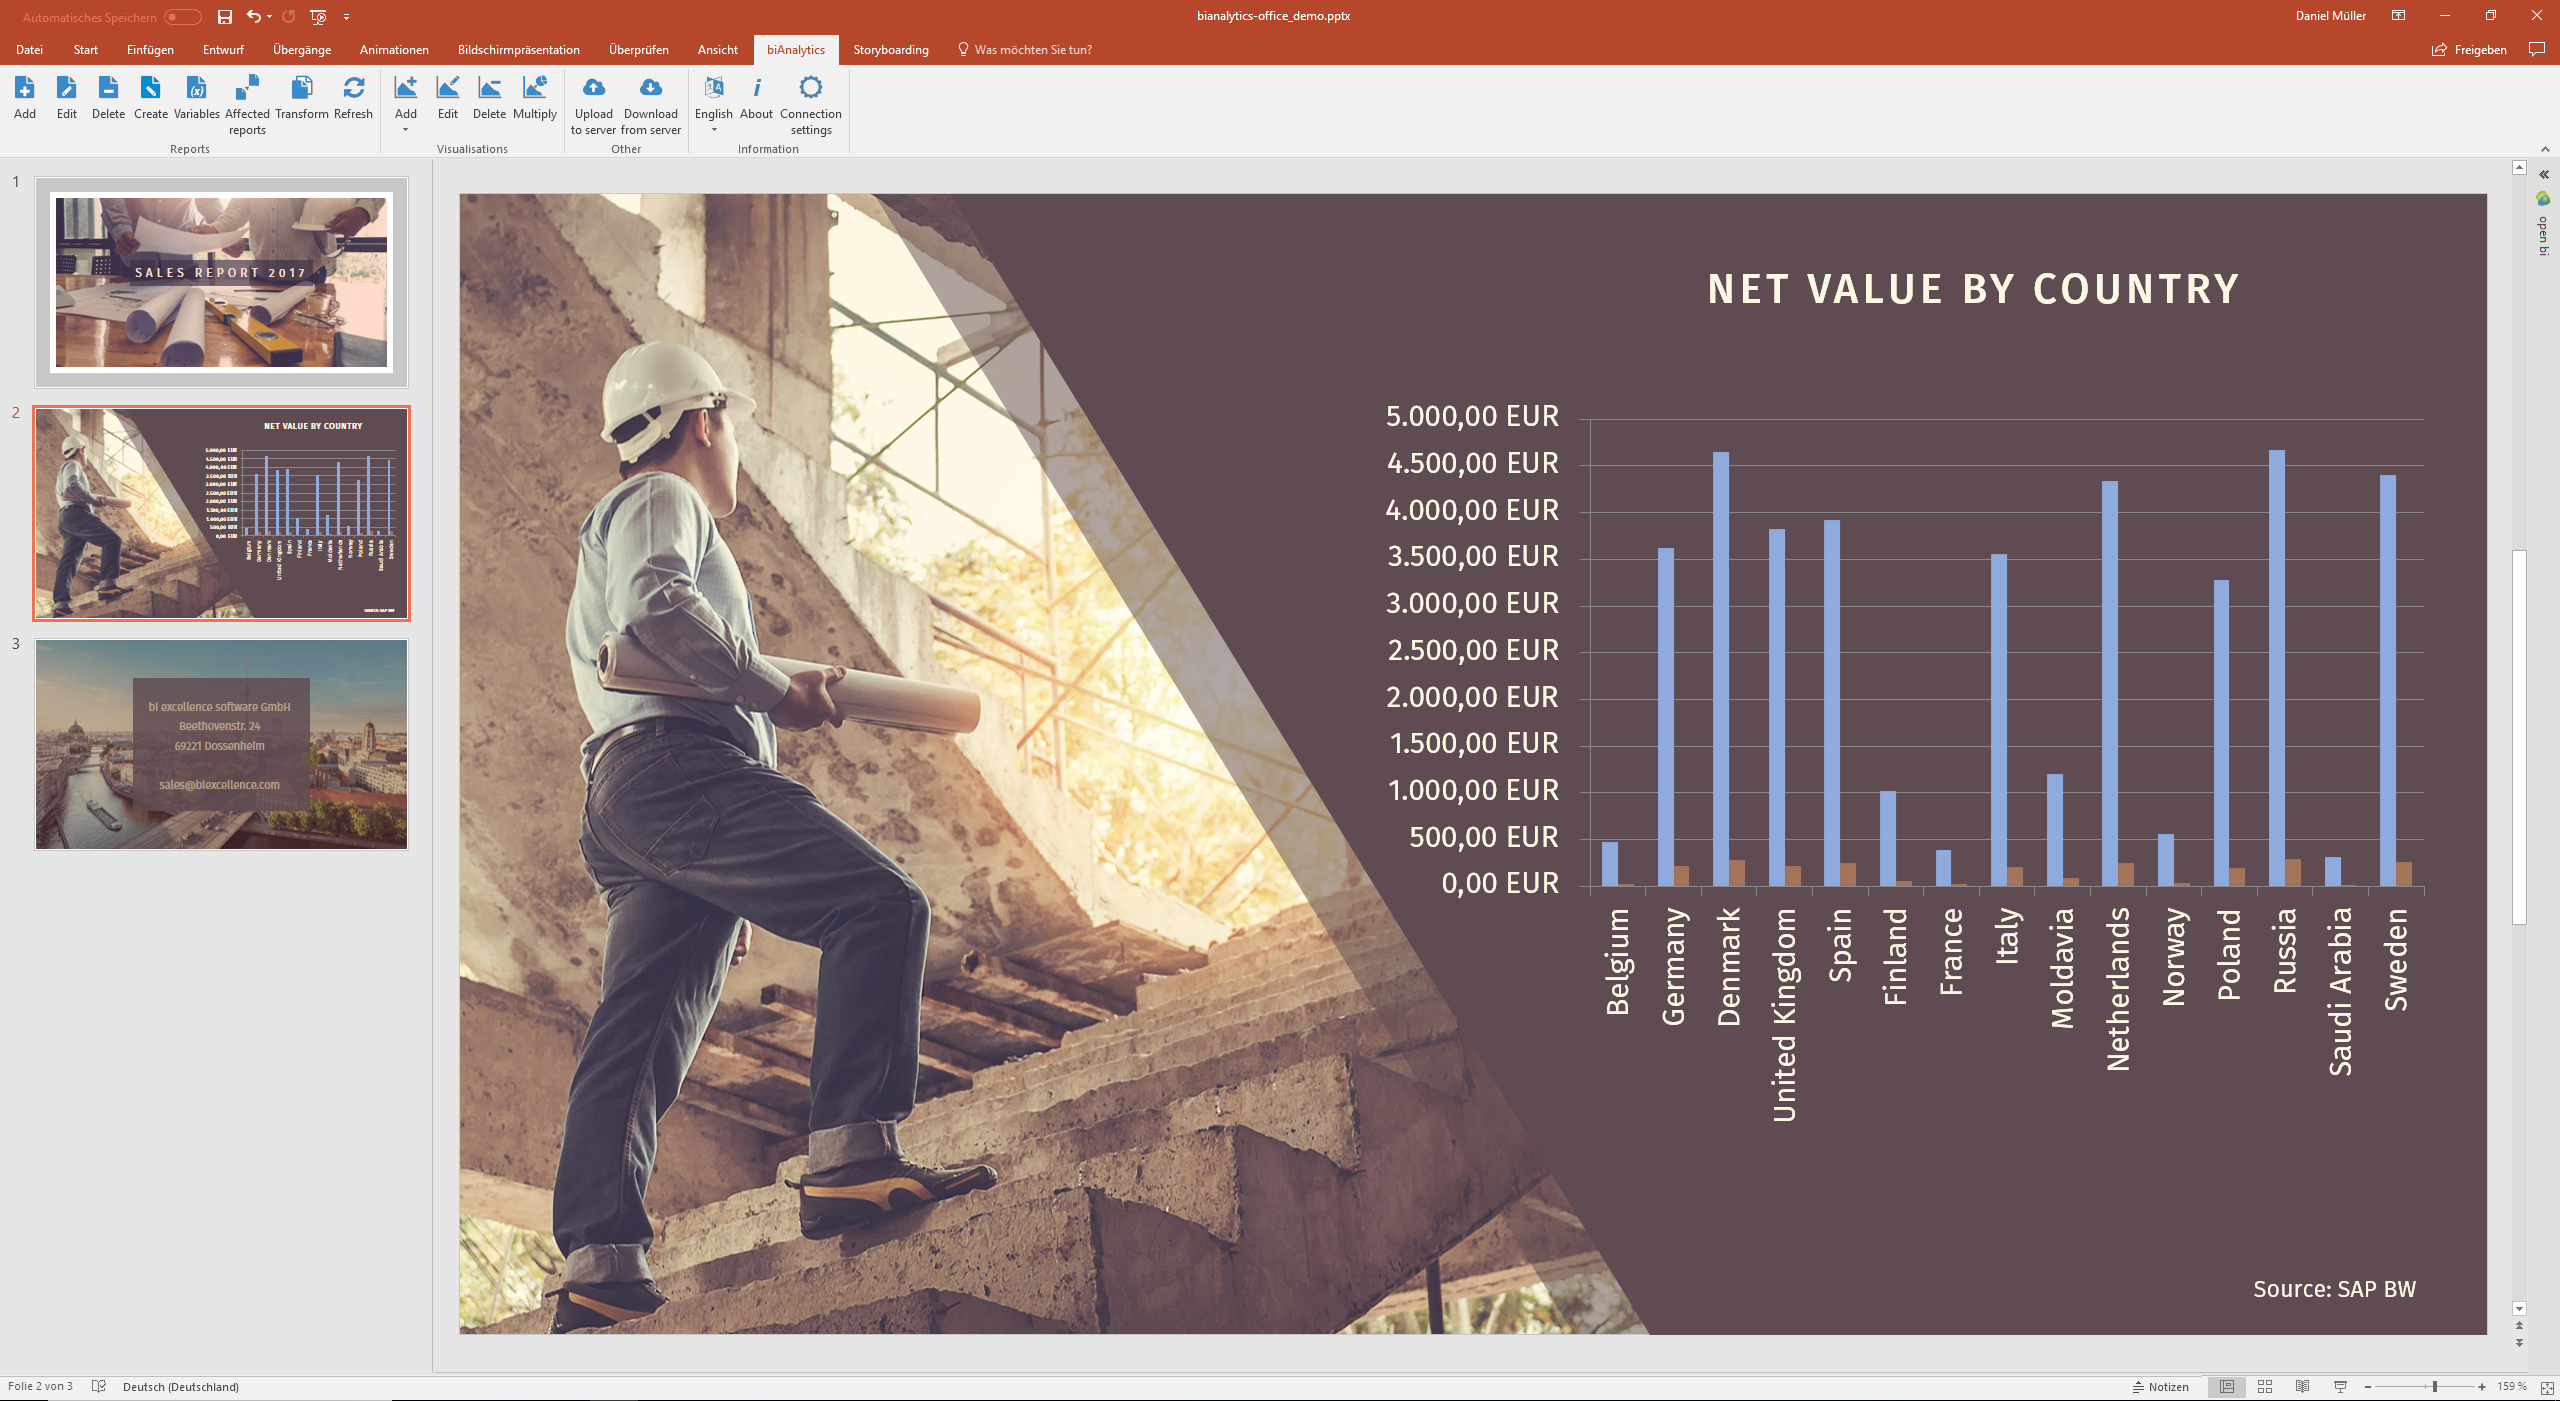
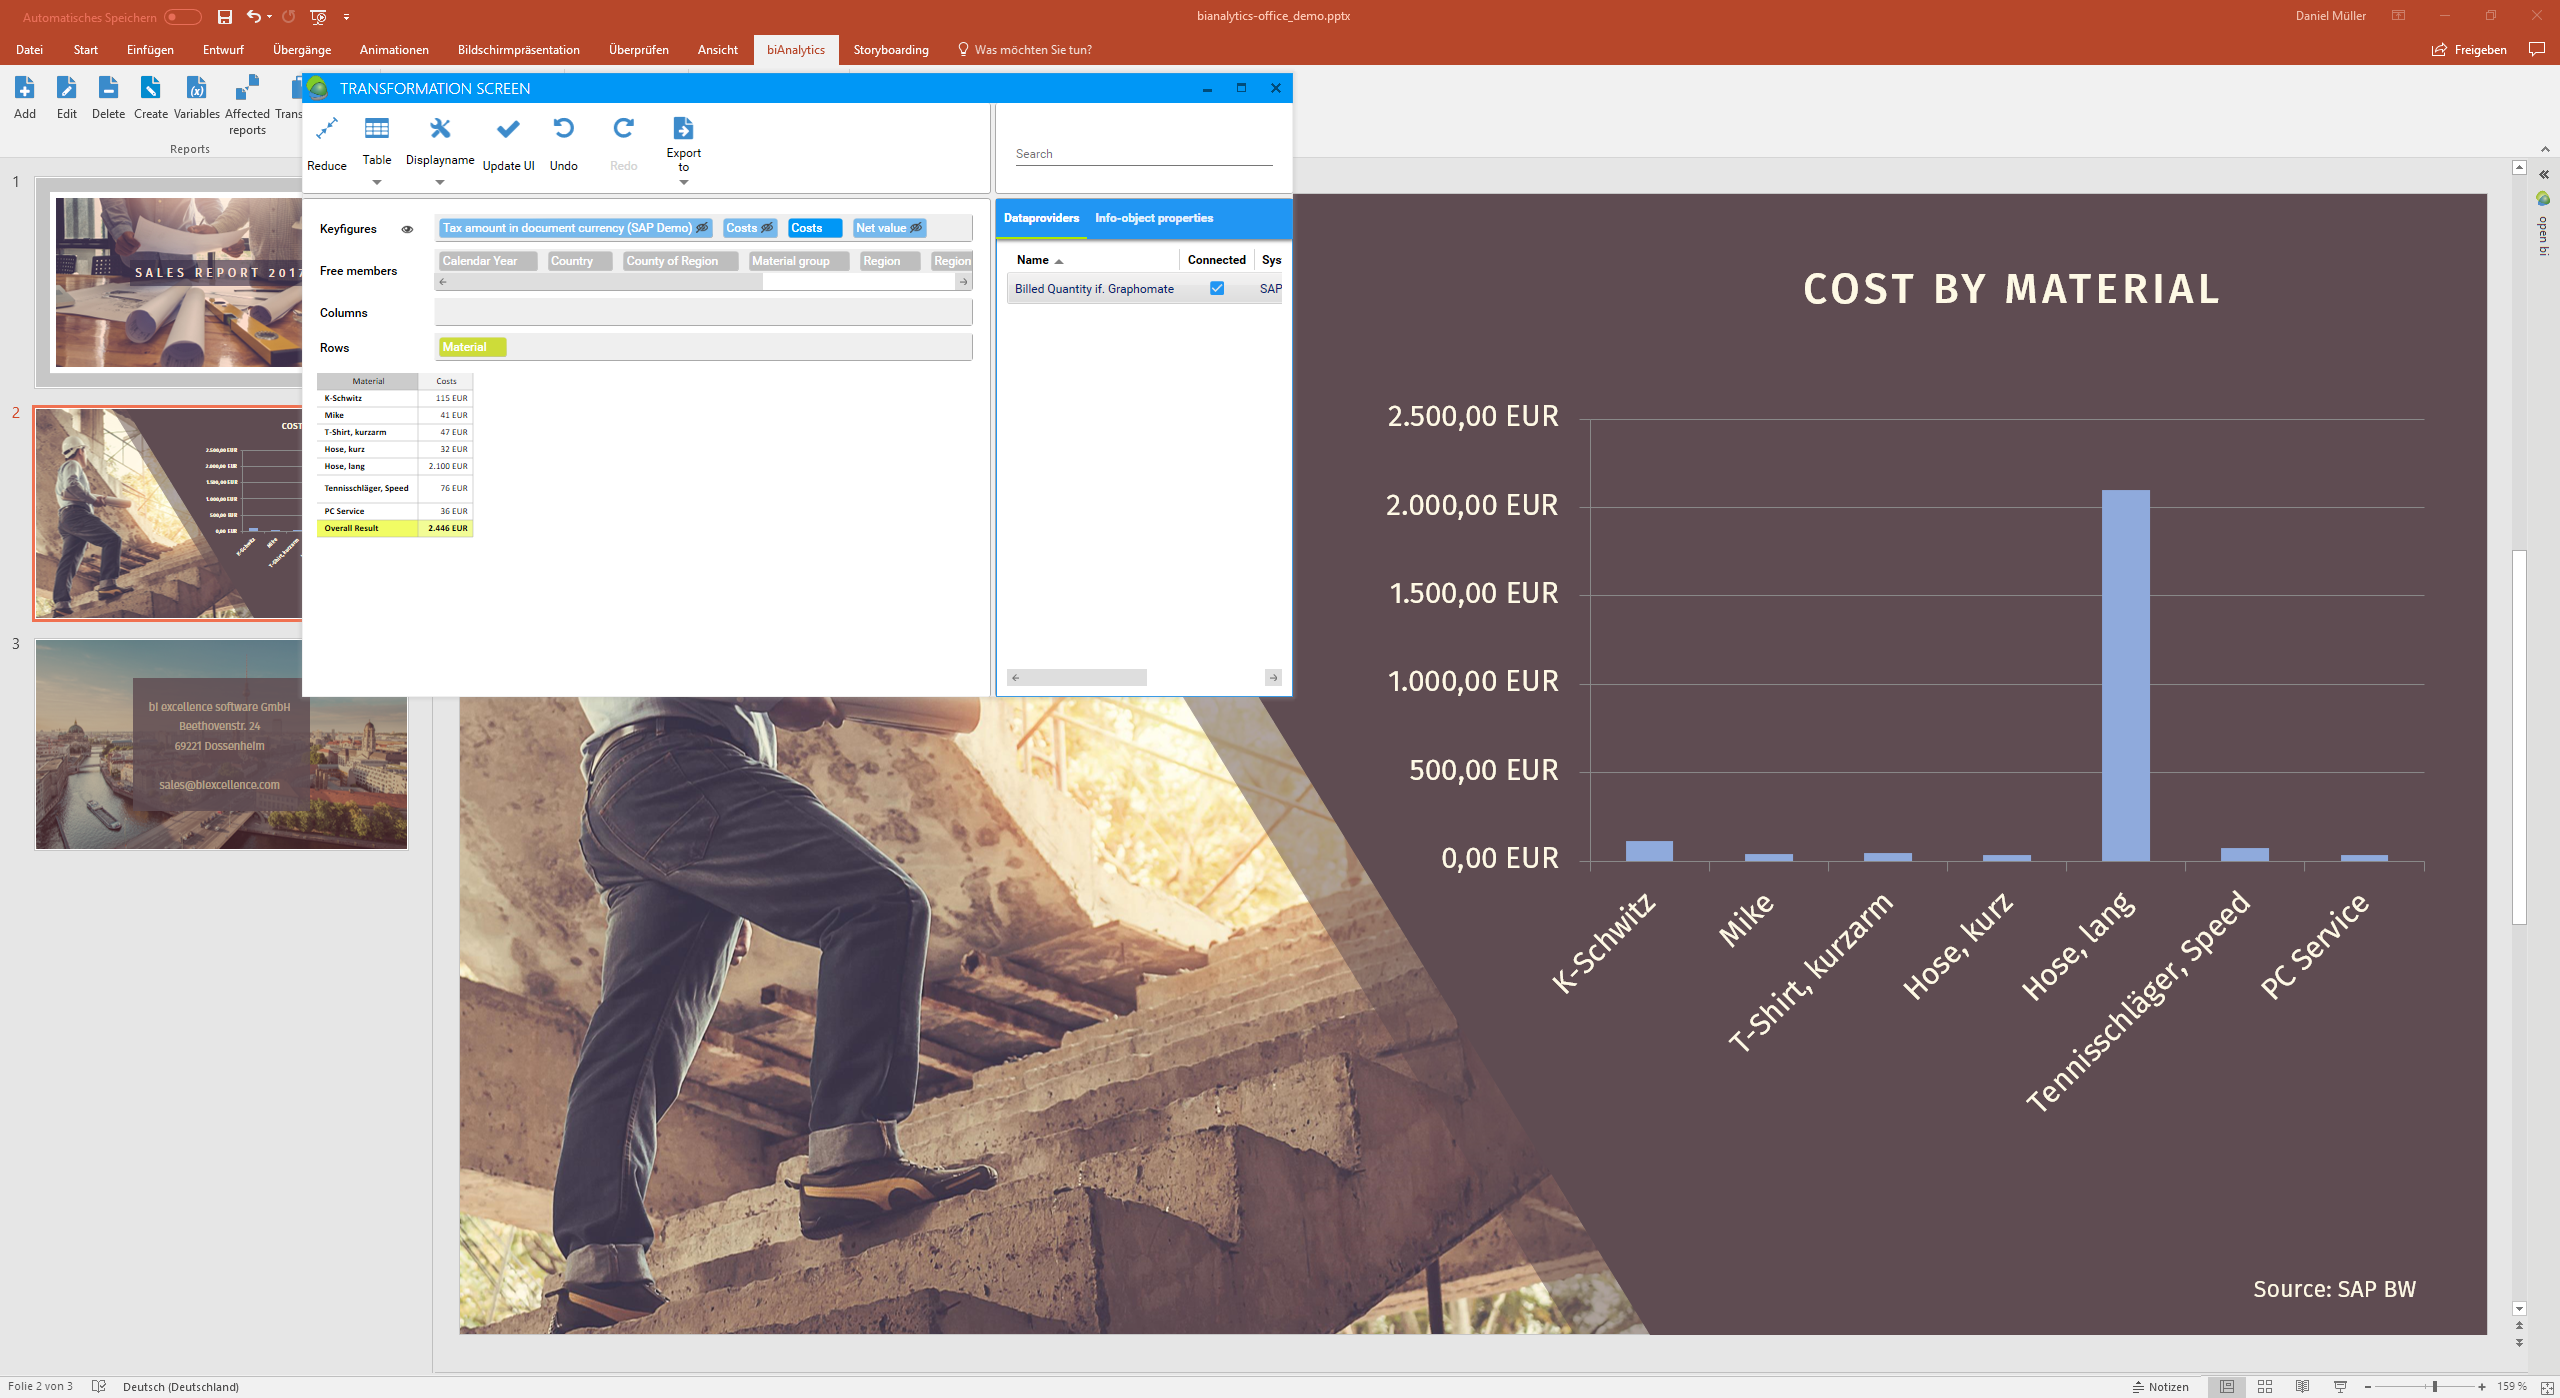
- Since biAnalytics is an interactive tool I can also change the view of the data that is visualized. I pull up the transformation screen and see all the key figures and dimensions that are available in this report.
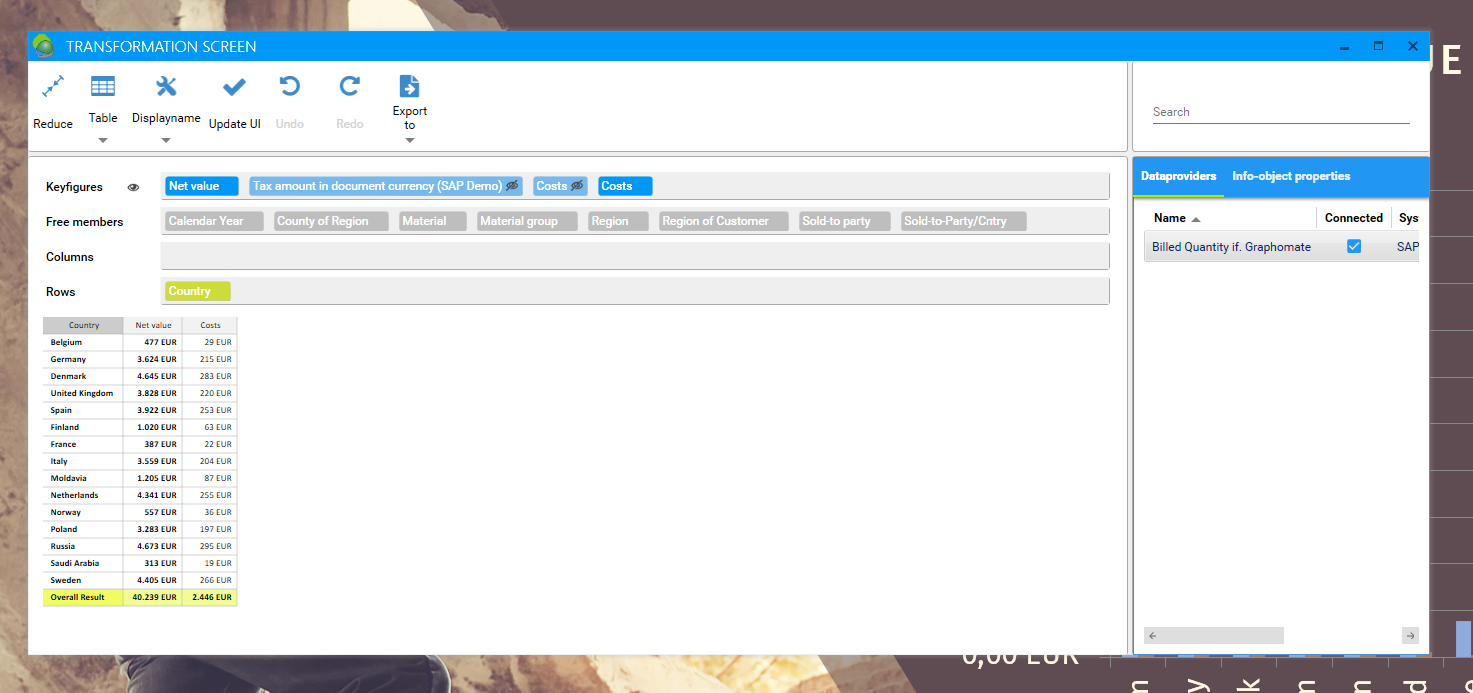
- This makes it incredibly easy to define custom views on the data or for example answer questions during a presentation in a spontaneous way!
Feel free to contact us if you want to try our biAnalytics Office on premise.
Of course, with your SAP BW Queries you can also use all other biAnalytics Office features, which have been described in other blog posts!